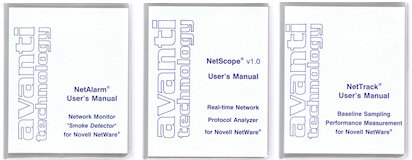
| << Previous Tip | > Tips Table < | Next Tip >> |
Memory Usage Tracking (NetWare v5.0 and later) |
|
With the introduction of NetWare v5.0, Novell added a significant
number of new options to the internal Debugger, as well as options
that can be specified at NLM LOAD time on an case-by-case basis.
With proper understanding of the internal operations of NetWare,
these new options can provide a wealth of information useful, not
only for debugging ABENDs but, for monitoring and tracking memory
usage on the Server.
Two of the more common causes of Page Faults on NetWare Servers occur
when memory is accessed beyond that which was allocated by the NLM
(Buffer Overrun) and when a memory block previously allocated
by an NLM is freed (released) then subsequently accessed by the NLM
(Freed Memory Access).
Novell has provided two LOAD time options which can be used to check
for such memory problems:
Provides the strictest check as it limits the memory allocations to
precisely that specified. (Note: By default, NetWare will both
pad and align memory allocations for added protection and optimal
performance.)
Provides less a strict check (still more than the default of no option).
Memory allocations are still padded, but not using the same method or
alignment criteria that is used when no option is specified.
As previously noted, the default memory allocation method is optimized.
Using either of these documented options results in a special debugging
method being used which requires additional memory resources and can
increase the time require to allocate and free memory by a factor of
two or three.
(Note: Only the NLMs loaded using these options are affected.
These options do not have a Server-wide impact.)
With the introduction of NetWare v5.0, Novell also added a
Stack Overrun detection option.
Stack Overruns are the most common cause of Double Fault ABENDs
on NetWare Servers.
The following SERVER.EXE command line option enables
Stack Overrun detection:
This option enables Stack Overrun detection for all threads on the
Server with minimal impact on performance.
(Note: Walking the stack will reveal the source of the overrun
and the ABEND.)
The following Debugger options can be used to monitor and track
memory usage on the Server:
|
||
| Command / Option | Summary | Description |
| .MO nlm | Memory Outstanding | Lists the individual memory allocations by an NLM (offset and size). |
| .MR | Memory Resource Tags | List the number of allocations and size for memory resource allocations (by NLM) being tracked by the Server that are greater than a user specified minimum. |
| .MS | Memory Summary | Lists all the memory pools and allocations of memory on the Server. |
| .MT | Memory Total | Lists memory allocations totals (by NLM) that are greater than a user specified minimum. |
|
|
||
| << Previous Tip | > Tips Table < | Next Tip >> |